Japanese Sire Ranking Analysis
In this review of Japan’s top sires we look closely at the ‘portable assets’ represented in the underlying genetics. Is the Western obsession with Hyogo (Tajima) supported by similar selection demand in the world’s most science-driven Wagyu production market? Or does Japanese breeding identify better or additional alternatives? There are significant surprises in the analysis.
Widespread Japanese Wagyu market support for genetic analysis as a review method for leading Japanese sires is a valuable tool for overseas breeders, International herd founders remain prominent in many leading Japanese pedigrees today, and the differentiated performance characteristics of different prefecture herds is well recognised.
Finally, we look at applying this information to Australian herds and breeding. Is it possible? How can it be done?
- How To Use Japanese Sire Ranking Data in Australian Production
- Key Points: The Challenging Genetic Composition Of The Japanese National Herd
- Key Points: On Japanese Production Systems
- Key Points: On Japanese Measurement Systems
- Top Japanese Market Black Wagyu Sire Tables (April 2016 – September 2017)
- Top 10 Japanese Sires By Progeny Number
- Top 10 Japanese Sires By Carcass Weight
- Top 10 Japanese Sires By BMS
- Top 10 Japanese Sires By $$ Value (JMGA Grade)
- Using Japanese Sire Ranking Data in Australian Selection
- Comparison: Genetic Composition of the Australian FB Herd
- Comparison: Australian FB Production Systems
- Comparison: Australian FB Measurement Systems
- Adapting Japanese Top 10 Sire Knowledge To Australian Selection
How To Use Japanese Sire Ranking Data in Australian Production
Key Points: The Challenging Genetic Composition Of The Japanese National Herd
Over more than 50 years of peer-reviewed academic publication, Japanese animal science has described national herd origins in genetically distinct prefecture-based sub-genomes and the emergence of the national Japanese Black herd of 2018. The Japanese Black is effectively more than one breed. (Details are available in the prefectural herd descriptions on this website.)
The impact in short is that in Japanese production, prefectural herd genetic analysis provides essential data informing national industry understanding: from the evaluation and selection of national progeny test candidates through to descriptors in national sire catalogues. Preservation of genetic diversity is a further critical application of genetic understanding.
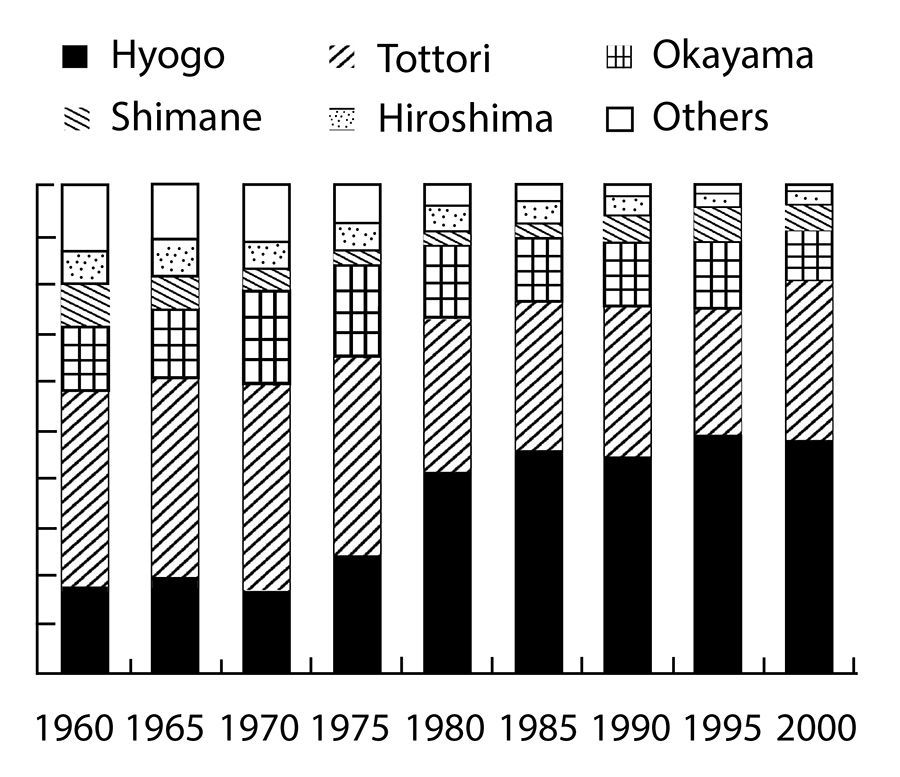
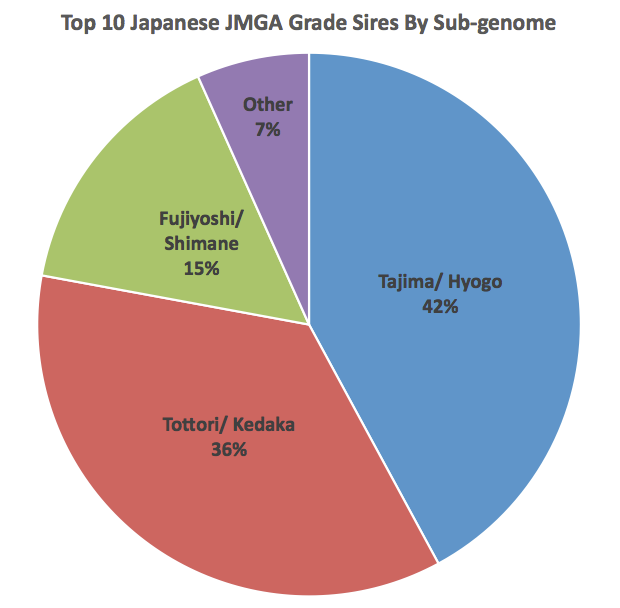
The following chart illustrates the relative influence within the Japanese national herd of the five most important sub-genomes. Consistent leaders are Tottori (Kedaka/Eikou lines) and Hyogo (Tajima, Kunanami and other lines).
Key Points: On Japanese Production Systems
National consistency in grow-out to slaughter is ‘absolutely’ achieved in Japanese systems. Calves are supplemented from shortly after birth through to calf sales at around 280kg. A feedlot equivalent DOF of about 600 days is a similar national standard, with an entire industry dedicated to the production of complex rations for different parts of the process. Animals are slaughtered at a similarly consistent point, around 900 days of age. Considerable effort has been put into reducing the lengthy cycle, but so far this has not proven economically possible whilst maintaining competitive carcass quality standards. Progeny test and carcass competition cattle are consistently slaughtered around 24 months of age and some carcass trait measurements extrapolated to give 900-day-equivalent outcomes.
Key Points: On Japanese Measurement Systems
Japanese Wagyu production was an early adopter of BLUP-based carcass EBVs in 1991. This is the same technology that drives Australian BREEDPLAN EBVs and many similar metric systems worldwide. However, in Japanese Wagyu production, BLUP EBVs are generated only from carcass data and then only for the private use of individual herd owners. Consolidated national sire rankings are derived from a national database of slaughter cattle, and then presented in tabulated form as we do for this analysis, using actual carcass data.
All carcasses are graded within the multi-trait Japanese Meat Grading Assn (JMGA) system, which also captures production efficiency metrics such as “Yield”. See full JMGA details and examples elsewhere on this site. JMGA grade defines carcass price, rather than ‘famous’ individual trait measurements, such as marble score. It should be noted that the JMGA MS tools can accurately measure over double the IMF content of mainstream Australian metric (AUS-MEAT) systems.
The 200-400-600 day performance BLUP EBV values familiar to Australians are not used in Japan, where Japanese Black breeder candidate phenotypes are individually assessed and measured as part of the registration process. A ‘gating’ issue for the Australian style of metric system is the phenotype variability/heterosis within the Japanese national herd that is the direct result of the constant joining and re-joining of animals of different genetic composition within the ‘same breed’. Hence the Japanese breeder’s constant vigilance and assessment of ‘good combinations’. Hyogo (Tajima) remains the sole ‘quarantined’ exception with no external genetics or /miscegenation allowed within the prefecture – but an extraordinarily low effective population size within the Hyogo sub-genome is the notable result.
Top Japanese Market Black Wagyu Sire Tables
(April 2016 – September 2017)
Top 10 Japanese Sires By Progeny Number
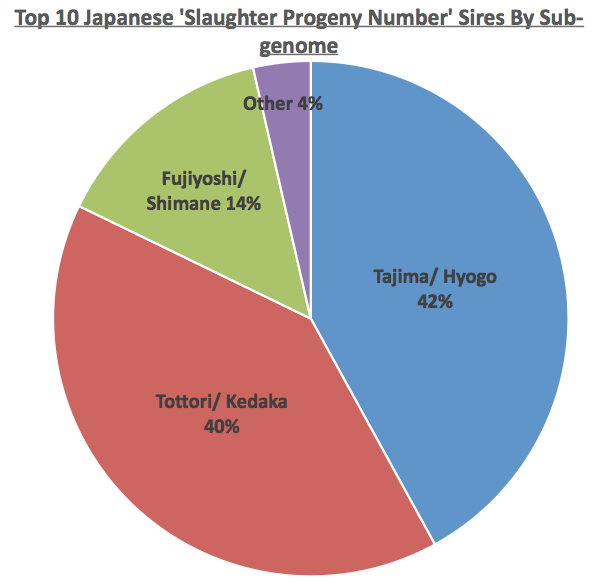
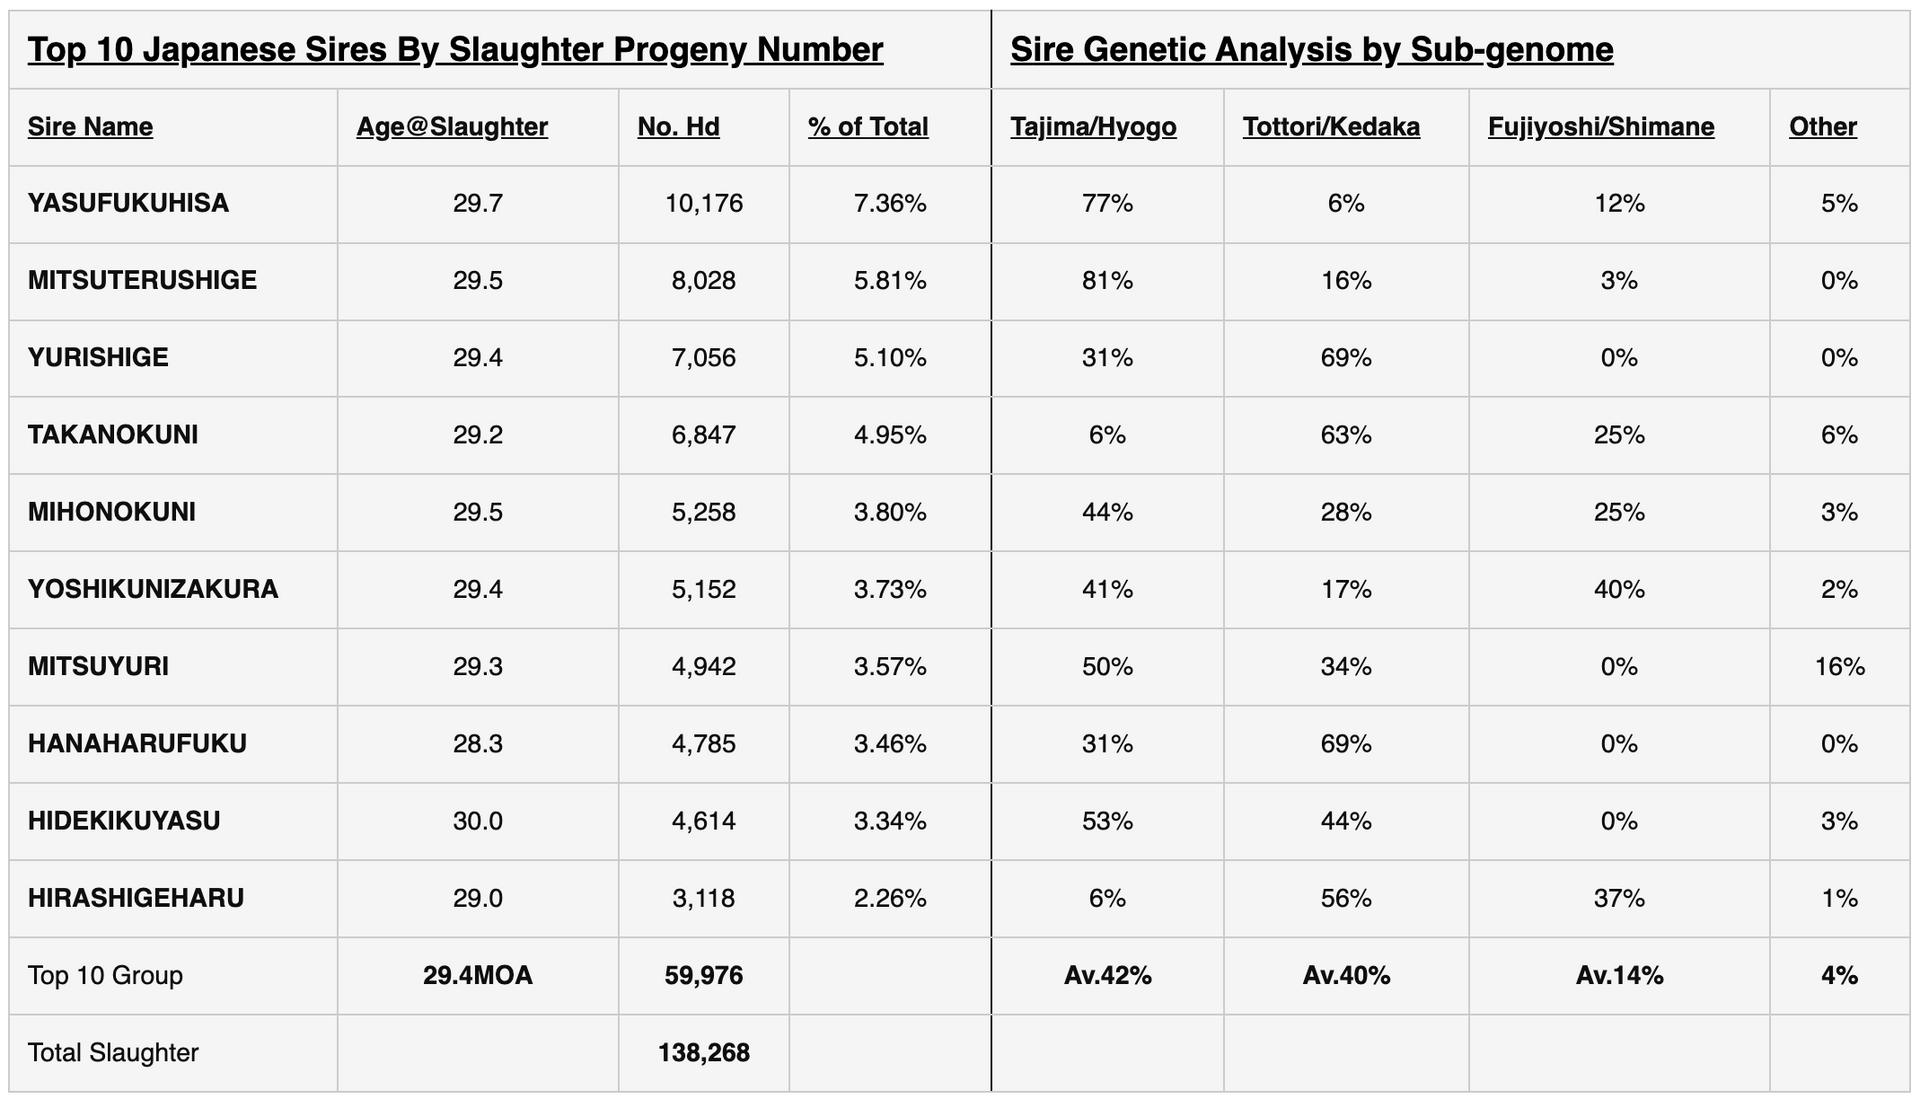
The table below ranks the national Top 10 Japanese Black sires by progeny number. This is effectively a ranking by ‘sire popularity’. Here we immediately see the dominance of two prefectural subgenomes in national performance rankings.
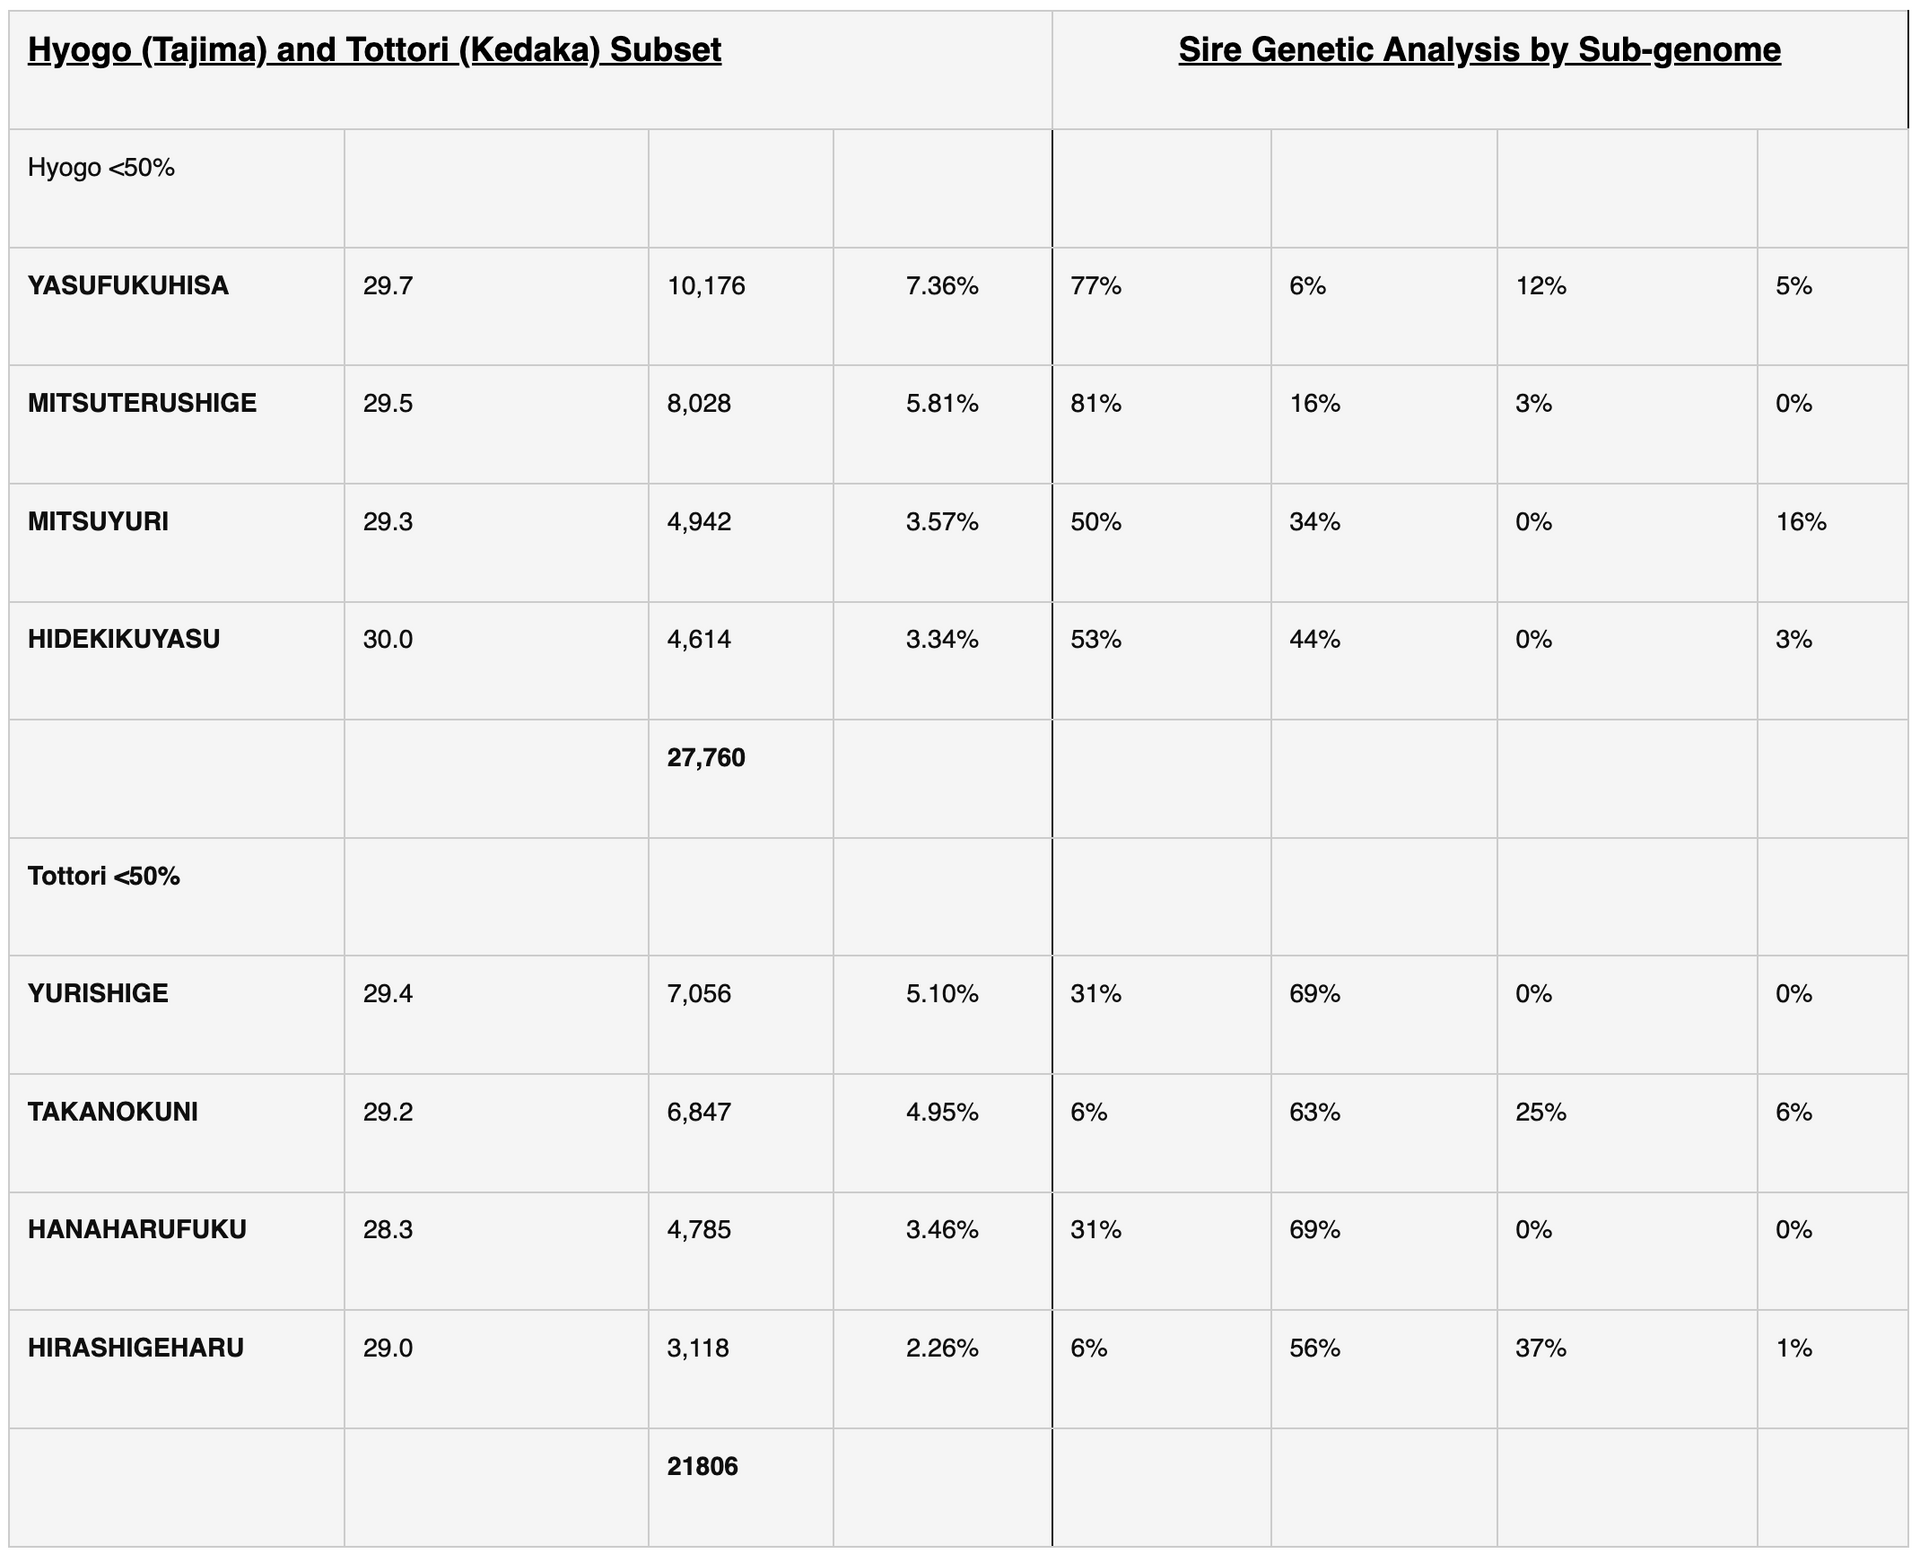
Analysis: Sires in which either Tottori or Hyogo genetics are 50% or more dominant account for over 49,000 of approximately 60,000 carcasses sired by this national Top 10. The average sub-genome content of a ‘Top 10 by popularity’ sire is Hyogo: 42%; Tottori: 40%.
Top 10 Japanese Sires By Carcass Weight
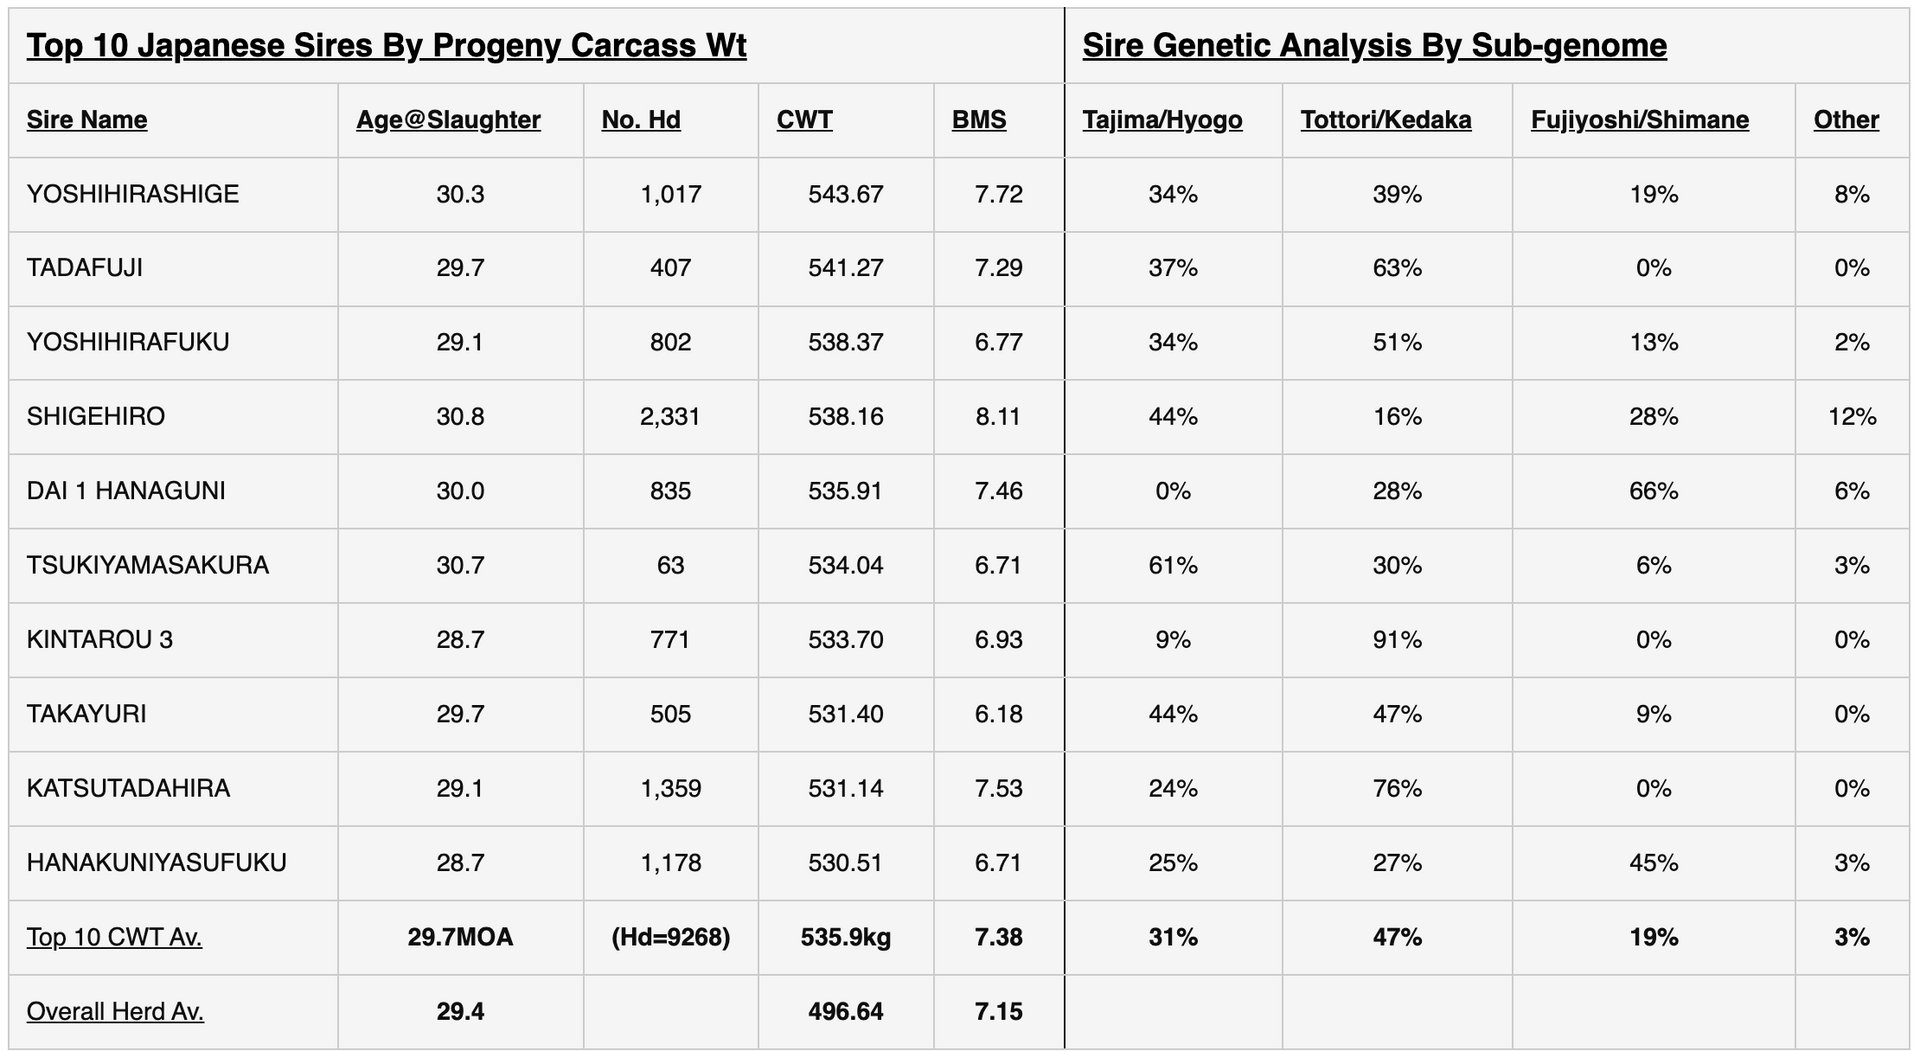
The table below ranks the national Top 10 Japanese Black sires by progeny carcass weight. As illustrated, greater genetic diversity is evident in the ranking, with more than the usual two prefectural genomes making significant contributions.
Analysis
In the first CWT table, Hyogo and Tottori genetics dominate, but it is clear on review that Tottori genetics are substantially the most successful in the national Japanese market CWT ranking competition. The average Top 10 sire here comprises 47% Tottori + 31% Hyogo/Tajima.
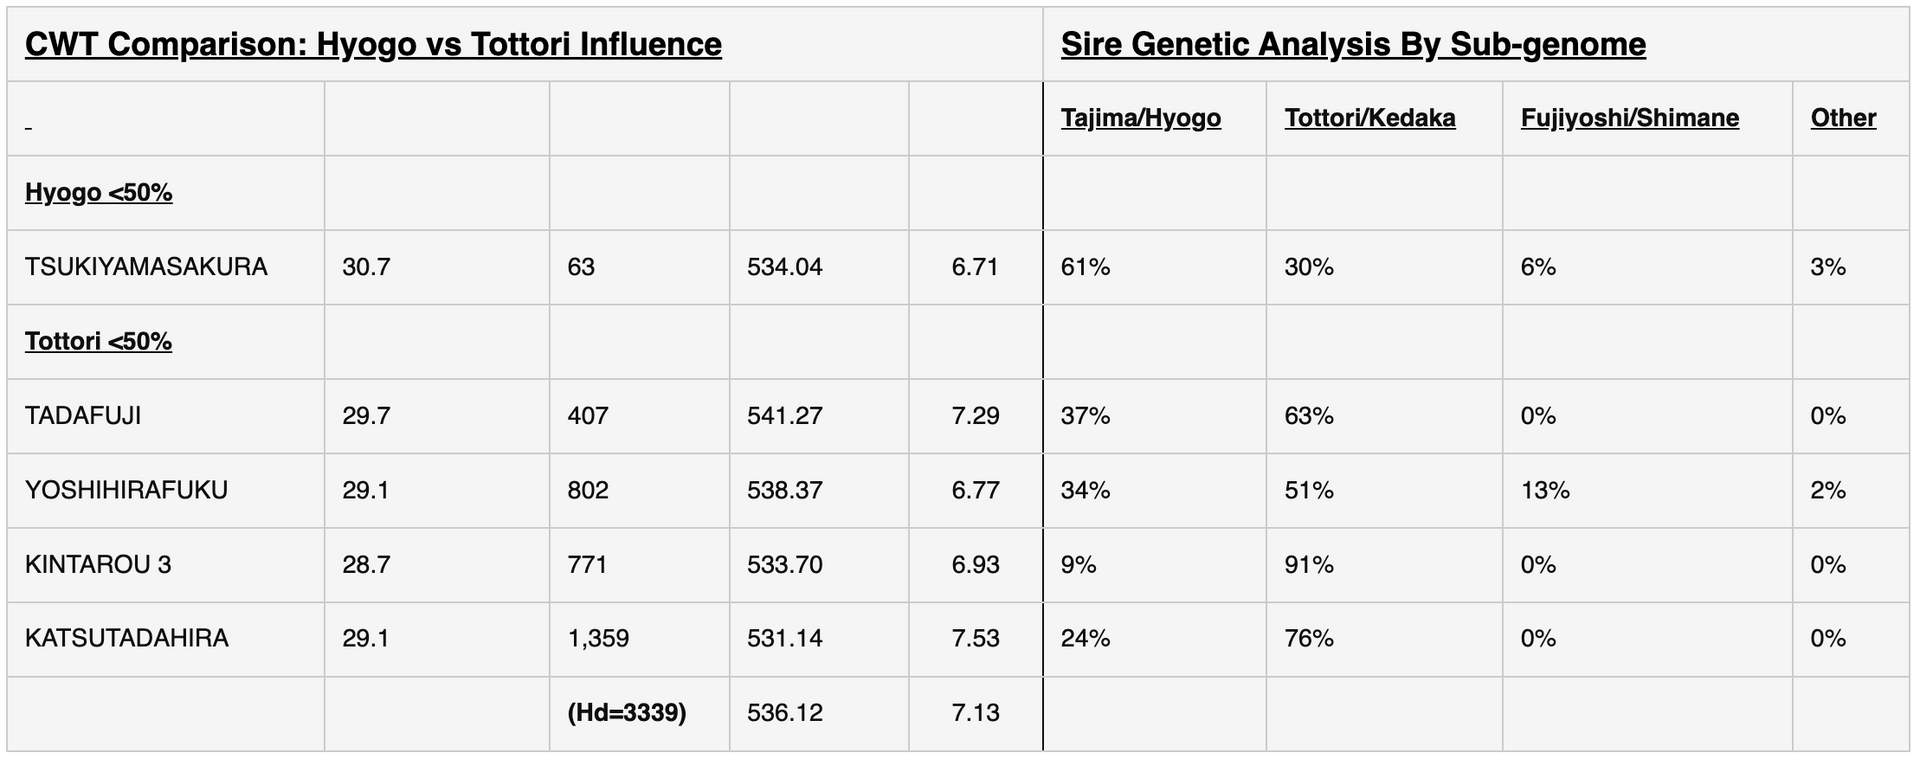
Looking to the second CWT table, If we then extract sires with 50%+ of either sub-genome, high Tottori sires are clearly dominant, accounting for well over 33% (3339hd) of all Top 10 (9268hd) progeny, while high Tajima claims a single place with 63 progeny.
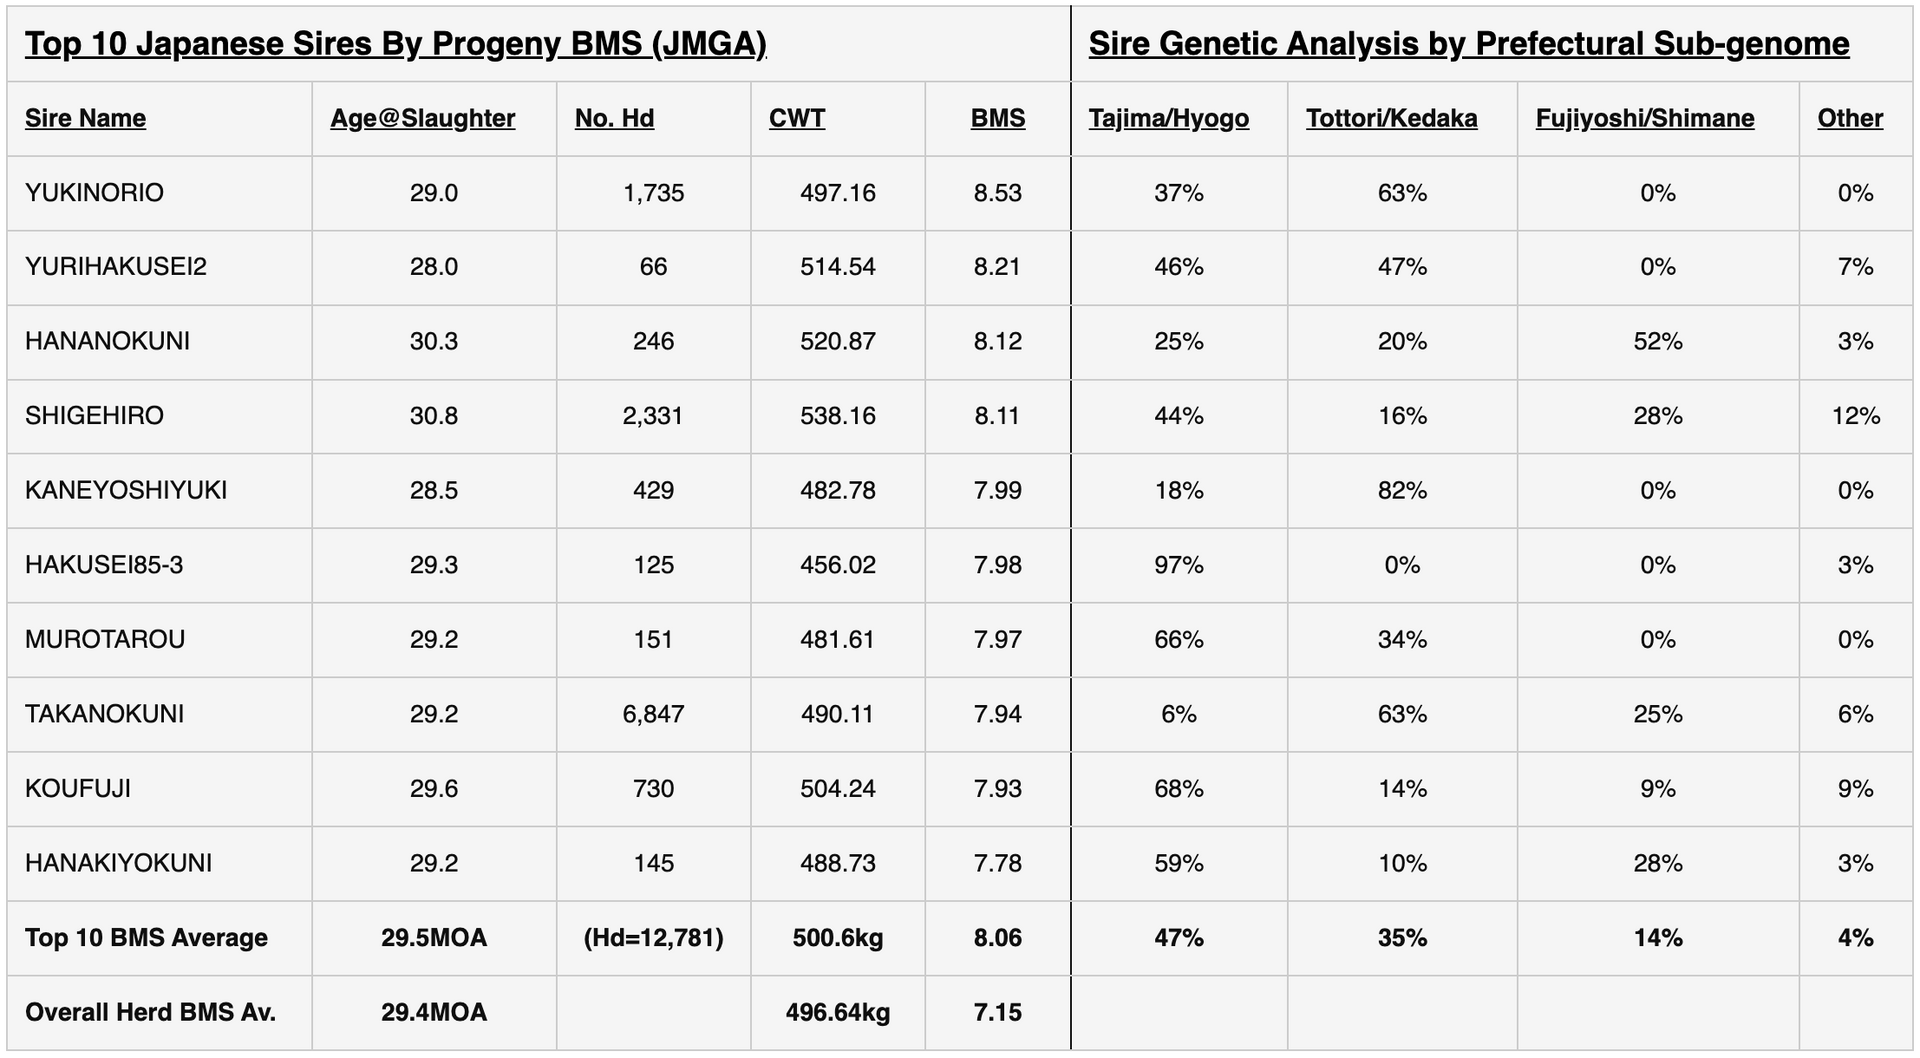
Top 10 Japanese Sires By BMS
The table below ranks the national Top 10 Japanese Black sires by Body Marble Score (BMS). This is the famous ‘defining’ trait of the Japanese Black, and in Western breeding it is this trait that has somehow become synonymous with Hyogo/Tajima lines. That is not reality – definitely not the current case in the Japanese carcass market, as we see here.
Analysis
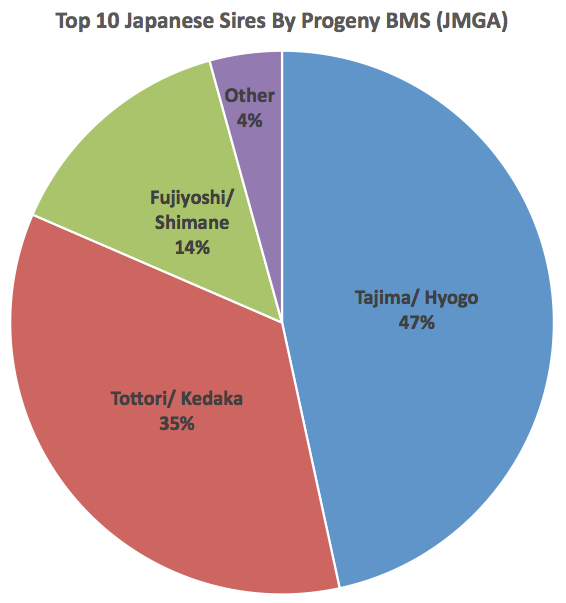
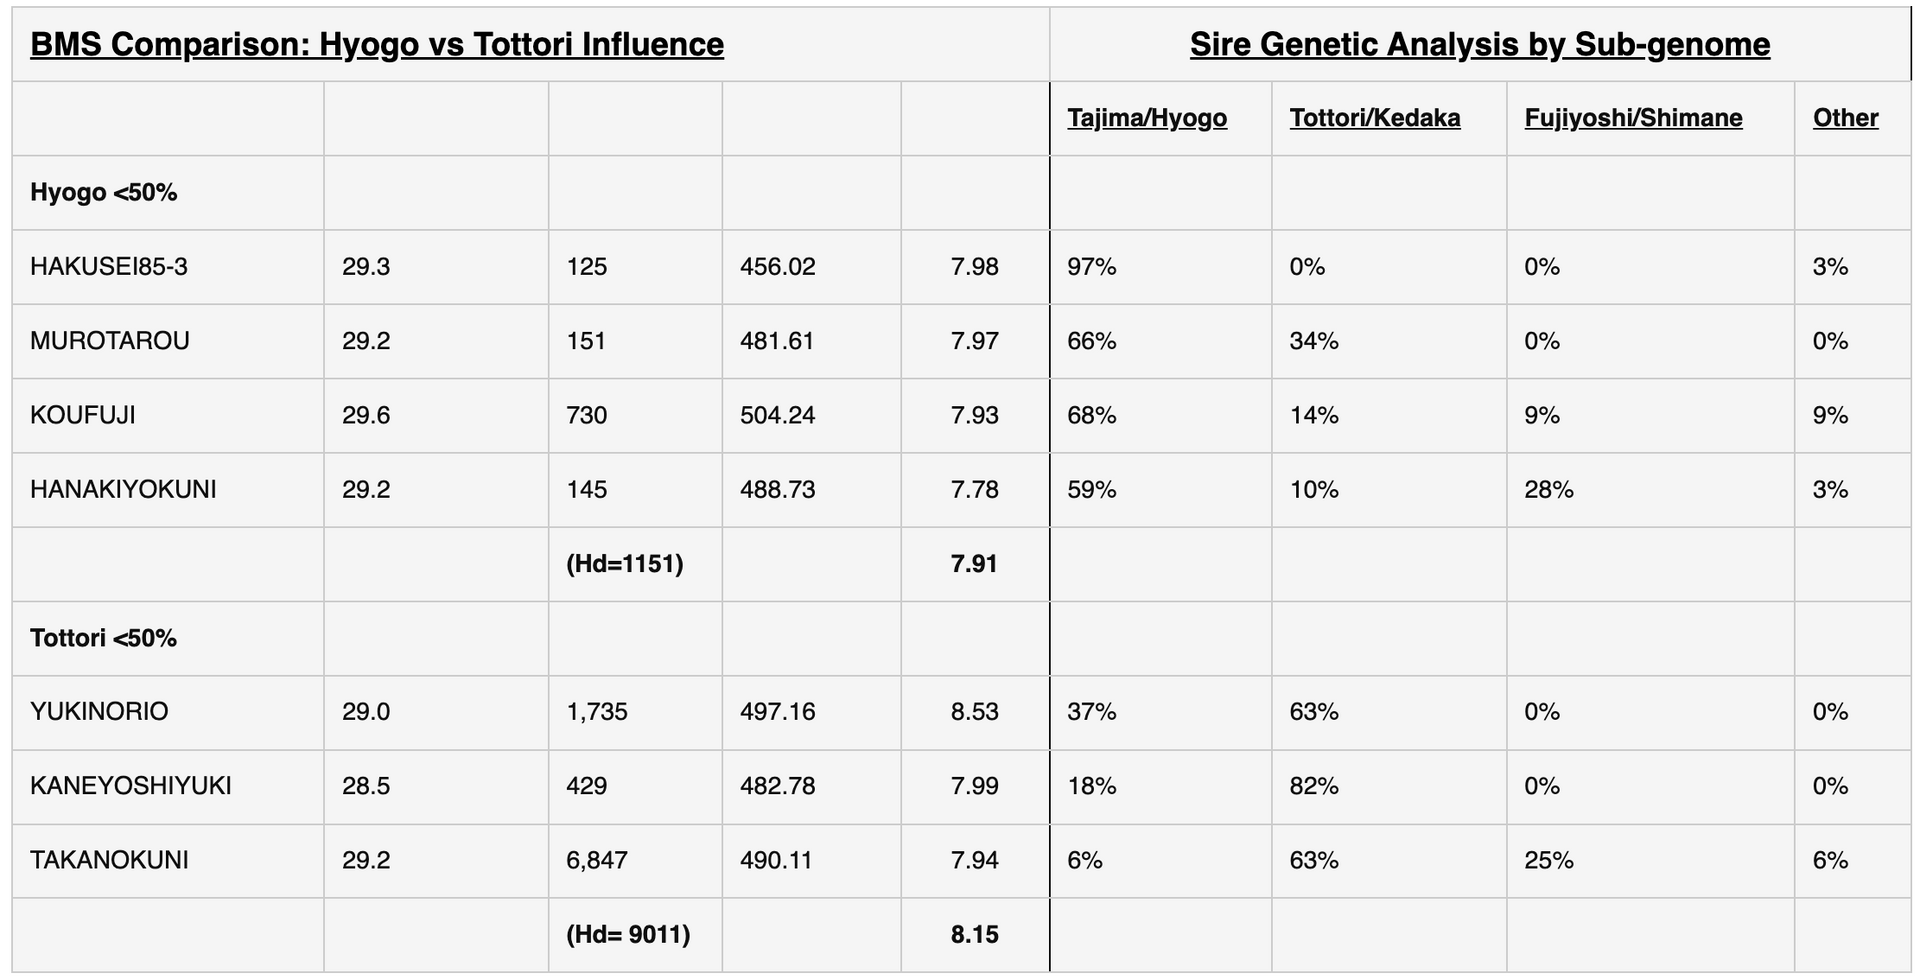
In the first BMS table, the positions of Hyogo and Tottori within the ranking appear at first glance transposed compared with CWT. The average Top 10 sire here comprises 47% Hyogo, 35% Tottori. But we move to the second table with 50+% influence sires, which always means separating these two leading genomes in these tables, it is clear that Tottori influence in three sires dominates in carcass numbers – accounting for 9011 head total against 1151 head total for four high ranked, high Tajima sires.
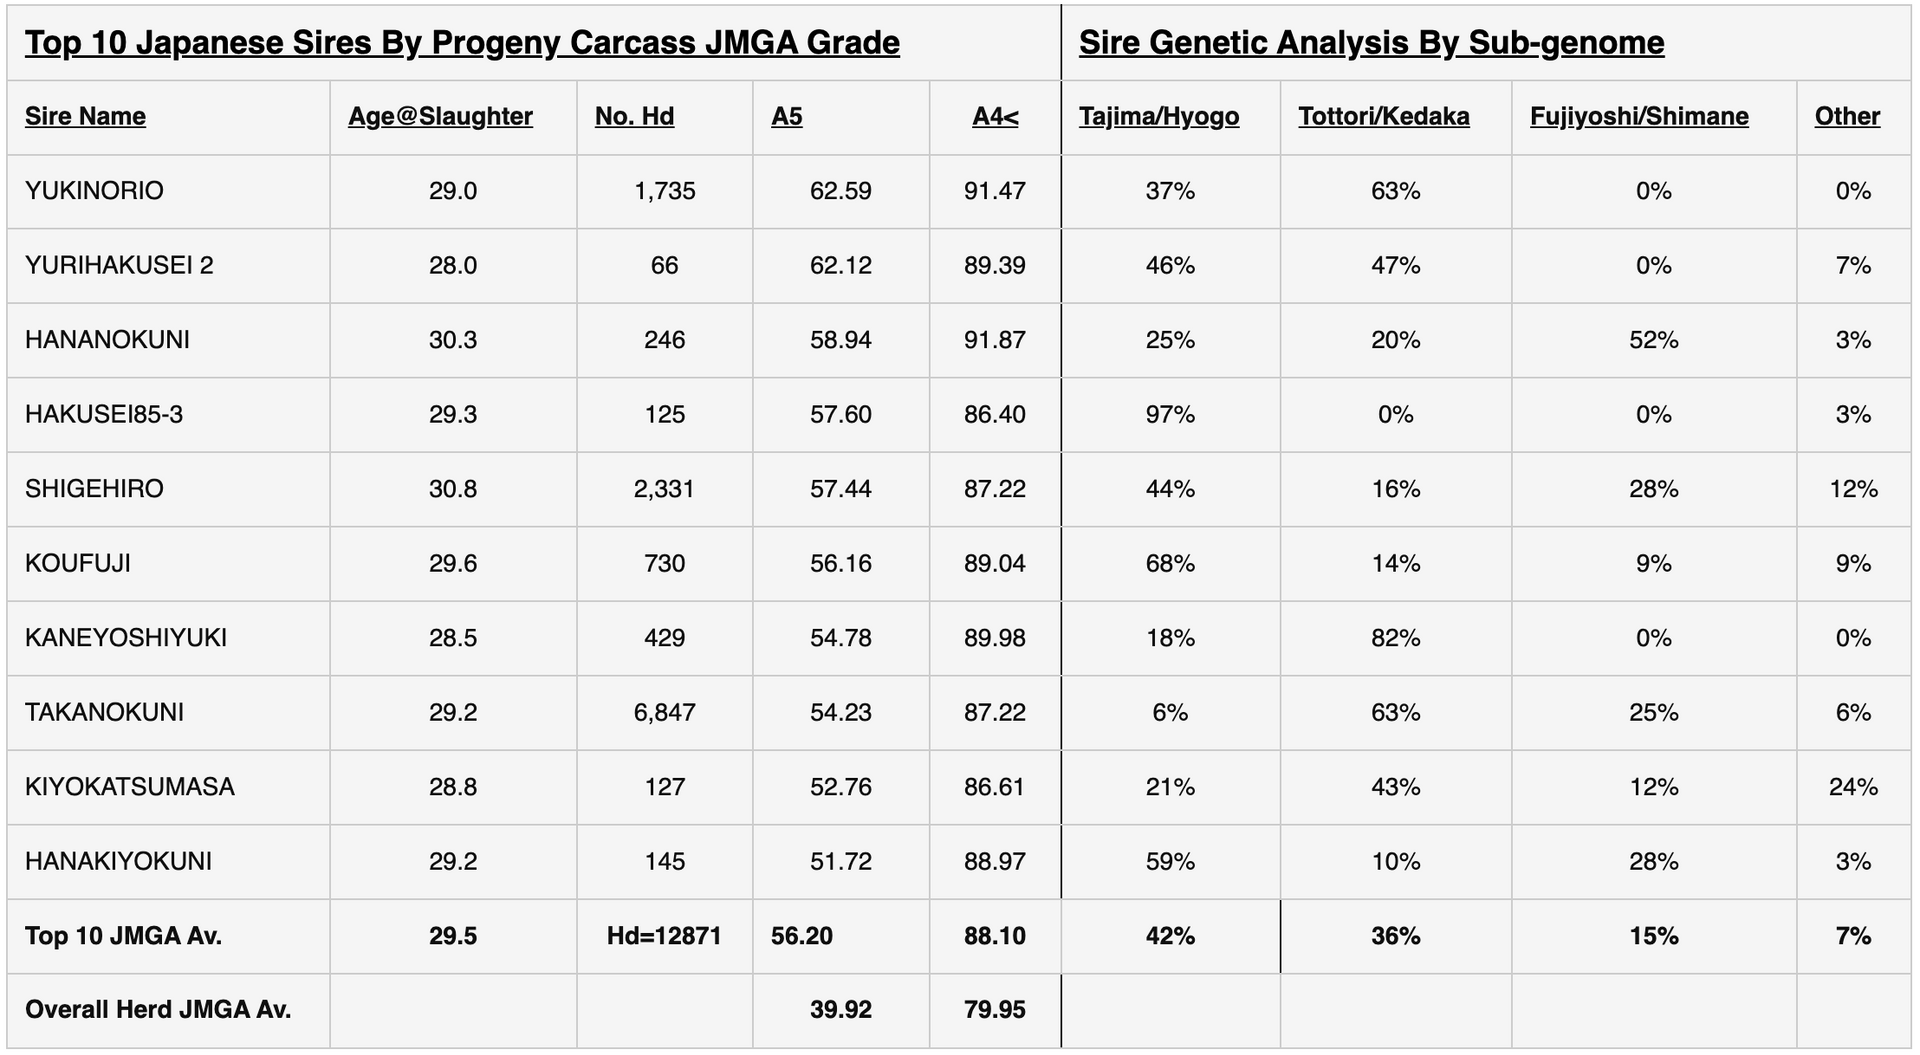
Top 10 Japanese Sires By $$ Value (JMGA Grade)
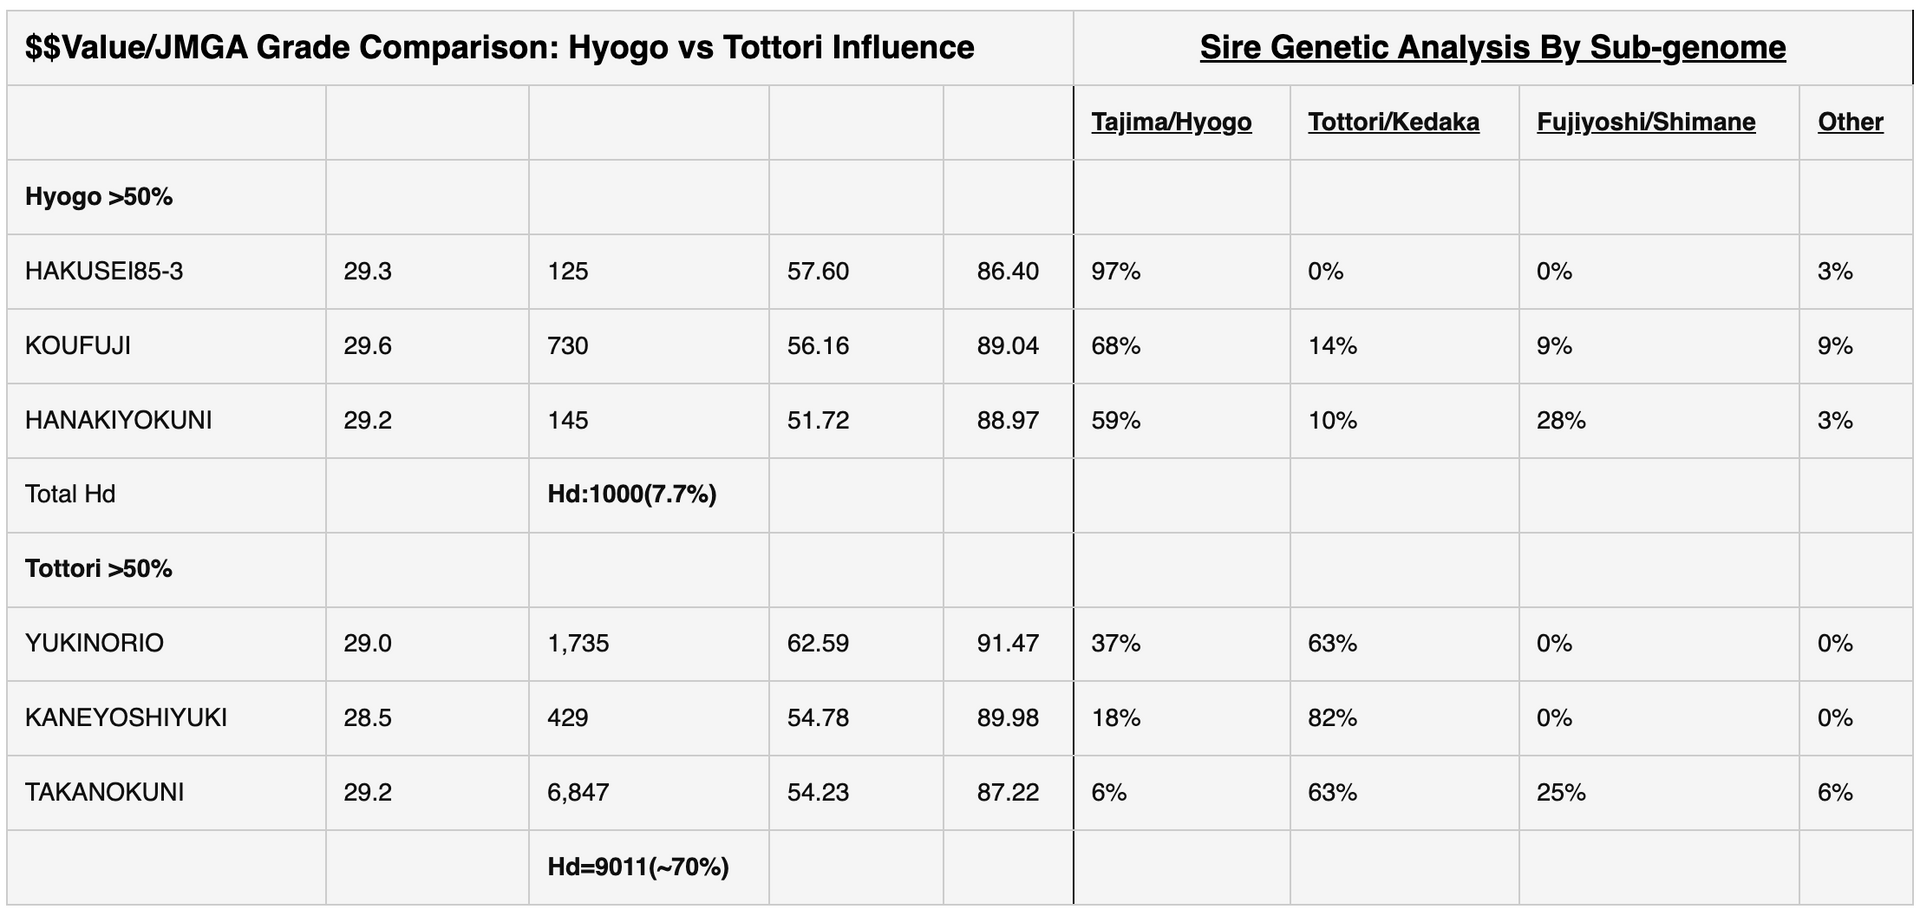
The table below ranks the national Top 10 Japanese Black sires by JMGA Grade. This is the yen/dollar defining table for valuation of progeny carcasses and overall sire market value. Here we see a similar situation to the outcomes in the CWT and BMS rankings: in terms of average sire content over the 10 sires, Hyogo/Tajima edges Tottori influence out by 42% to 36%. But when we move to the second table with 50%+ sires and look at actual progeny numbers, Tottori , with a 70% share, entirely dominates the Top 10 $Value ranking. Hyogo : 1000hd; Tottori 9011hd
Using Japanese Sire Ranking Data in Australian Selection
A useful way to parallel an international comparison of fullblood Wagyu sires, genetics and production methodology is a comparison (with Japan) of environmental factors, genetic composition, production systems and measurement/management regimes.
Comparison: Genetic Composition of the Australian FB Herd (Compared with Japan)
Major variation in individual animal results within 2016 research to establish a ‘Wagyu Content Test’ forced Australian breed management for the first time to recognition of the different genetic groupings within the Japanese Black. The research identified what most breeders already knew – the commodity grouping in the Australian national herd was Hyogo/Tajima*, and the ‘outliers’ were high Itozakura and Tottori animals. The proposed Wagyu Content Test became the current Crossbred Wagyu Test, which identifies Hyogo/Tajima genetics in non-pedigree cattle. Australia has failed to either expand this knowledge or support readily-available national herd analysis which would instantly identify all pockets of genetic diversity. Such diversity is evident in analysis of the Australian founder group, but much is already extinct in local breeding.
Comparison: Australian FB Production Systems
Inconsistency is the keyword for a comparison between Japanese and Australian production. Whereas ‘consistency’ is paramount in Japanese production – breeding and feeding – Australian FB Wagyu production varies substantially from between different breeders, feeder producers, and particularly feedlotters and vertical producers. Feedlot nutritional programs vary by feedlot. There are no accepted industry definitions for critical parameters such as Days On Feed ( DOF), and animals are slaughtered at a wide variety of end points, which makes effective carcass comparison difficult, when data becomes available.
Comparison: Australian FB Measurement Systems
As noted above, Australian Breedplan EBVs at the 200-400-600 days points are not available in Japan, where all emphasis is on carcass endpoints, measured via a national database and analysed by BLUP. Australian carcass data is contributed by producers operating a diverse range of production systems, details of which are not captured alongside the data. (Lack of definition of DOF, for example, creates a difficulty.) Nonetheless, worthwhile metrics currently resulting include AWA Carcass MS and CWT EBVs.
Carcass EBVs: One parameter measured in both Japanese and Australian FB datasets is Days of Age at slaughter (DOAS – or days of life). This is consistent in Japan at around 900 days or 29moa where it is a proven part of a meat quality regime. However, DOAS is quite inconsistent in Australia. There may be a reason for this: it was identified in an AWA Technical Paper published in 2017 (see AWA website) that the Australian MS EBV includes an adjustment which provides substantial incremental value in MS EBV values where slaughter occurs around 750 days or less. The reason for the adjustment is not clear, and no published peer-reviewed scientific support for such a ‘tweak’ is evident. However, it has a huge impact on Australian FB selection as the AWA MS EBV is then the principal ‘driver’ of the seedstock market influencer, the AWA Terminal Carcass Index (TCL).
Grading Systems: Australian FB carcasses are assessed by the national AUS-MEAT carcass assessment method, which offers very limited parameters compared with JMGA. Significantly, the top AUS-MEAT BMS score (MS9) is the equivalent to about JMGA BMS #3 on the JMGA BMS 1-12 scale (see details elsewhere on this website). As prominent Japanese scientists have demonstrated in Australian CSIRO publications, this makes identification of high performance local Wagyu quite difficult.
Diversity and inbreeding in the Australian FB population is not effectively measured, but the Crossbred Wagyu Test result gives a useful indication: the national herd has substantially become a Hyogo/Tajima herd. It is known from Japanese home herd scientific study that Hyogo/Tajima is the smallest (in effective population size) and most inbred prefectural population. Unfortunately, tentative Australian measurements of the local herd do not take into account such measured pre-existing, pre-export foundation group inbreeding.
Adapting Japanese Top 10 Sire Knowledge To Australian Selection
As noted in the Overview to this section, the Top 10 Japanese sires of today share important pedigree data with many international herd fullblood animals today. Within the pedigrees of select original export founder groups – some less than 20 years ago – we can see recent ancestors of these ‘Top 10’ sires, and also some significant genetic diversity. However, time is running out to preserve much of this.
The challenge for international breeders today is to identify, capture and apply these diminishing resources, then measure the increments they can deliver – both in production and diversity.
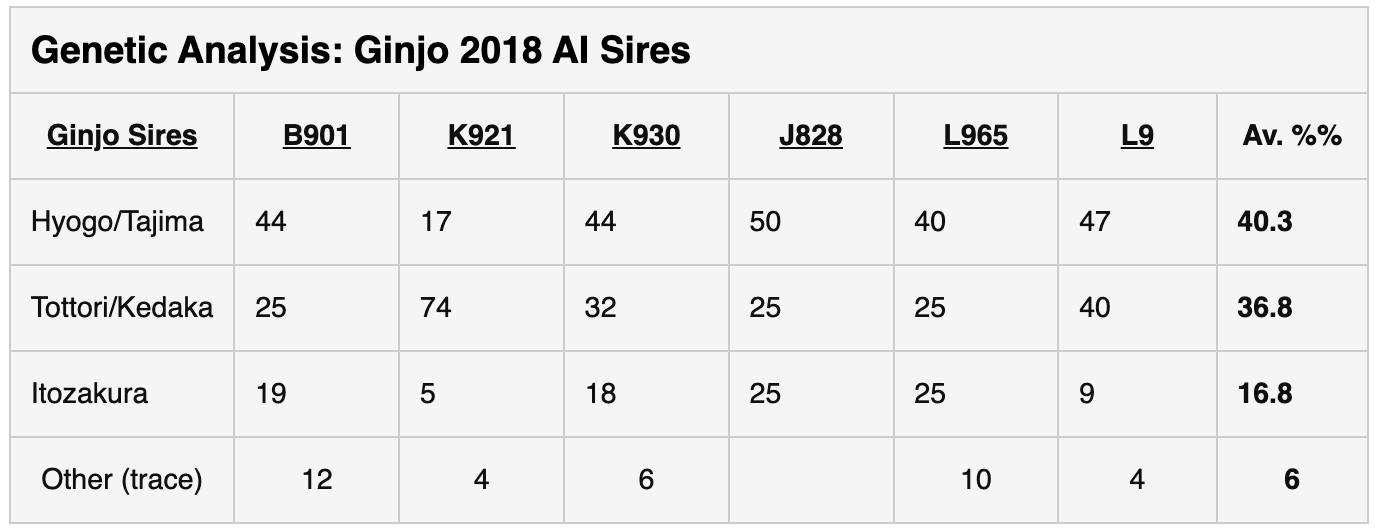
It can and has been done, for example, following is a comparative genetic analysis of the current Ginjo AI sire listing, with the To 10 Japanese Sires ($$Value/JMGA Grade)
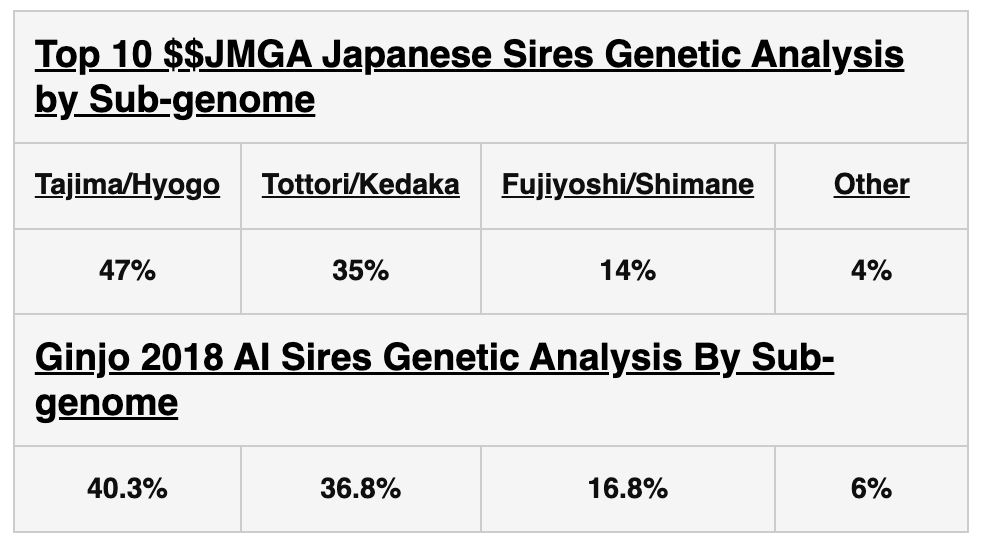
The Ginjo collection of Australian sires was assembled over a period of 5-10 years, using genetics from the Australian FB Wagyu herd. The result is a ‘building block’ selection that can be used to change the genetic shape of any FB herd, with a definite bonus both in genetic diversity and a variety of production parameters.
We are aware of other Australian breeders following similar routes to enhanced herd health and productivity. This is a direct route to bringing Japanese-style productivity into Australian FB herds.
Let’s Talk About Your Wagyu Breeding Plan
We'll Find the Right Wagyu Breeding Solution for You
Call us: